Using ASP to generate graphs makes it easy to integrate the display with the rest of your web application. Generating a GIF or PNG image allows a clear image to be produced, with optional transparency. Control over colours and text styles enables you to make your charts fit in with an existing web site design.
There are a wide range of properties that control the appearance of a graph. Most of these properties can be left at their default values allowing a graph to be produced relatively quickly. The overall size can be varied, including the length and position of the axes. The total values can be shown on bar charts and pie charts. A prefix or suffix can be added to these values to display currency or other units. Text annotations can be added, and on line graphs the plotted coordinates can be used. For full details see the online manual and also our demo section.
csDrawGraph is a COM object and can be used with other COM enabled applications, such as Visual Basic or Cold Fusion. It is not restricted to classic ASP. We have an OCX control, csXGraph, which is more suitable for use with visual programming tools. csDrawGraph can run in ASP.NET once it has been registered using late binding or more efficiently using early binding.
csDrawGraph version 3.1 introduced Base64 encoding, allowing the component output to be placed directly into an HTML image tag as a string, so the ASP code and image can be in the same script.
This component must be registered on the server before it can be used. It is available as a 32 bit or 64 bit component.
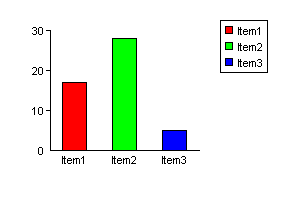
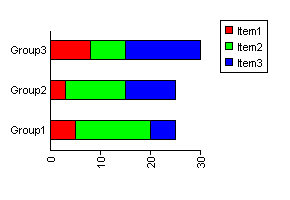
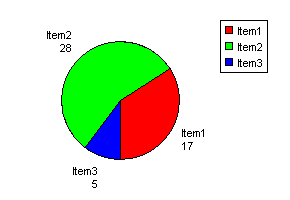
Here are some simple examples showing graph types:


A wider range of styles can be viewed in our Demonstration Area.
- We have some demos that you can view and / or download:
- Simple Example - A simple pie chart and bar chart, on one page. Shows both image streaming and base64 encoding.
- Database Example - This shows how graphs can be produced by taking data from a database.
- Image Map - A chart with a dynamically generated image map.
- Bar Charts - examples of bar charts.
- Pie Charts - examples of pie charts.
- Line Graphs - examples of line graphs.
- Stacked Bar Charts - examples of stacked bar charts.
- Some other useful links: (Some are specific to another component but still relevant)
- Displaying ASP error messages
- Component troubleshooting
- Streaming an image in ASP
- Passing URL parameters to the image script
- Tips on debugging
For a full description of all the properties, read the online manual. Or view the pdf version.
More on using csDrawGraph with Visual Basic.
More on using csDrawGraph with Cold Fusion.

