Tips on Debugging an Embedded ASP Script
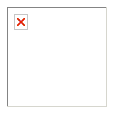
When the script that creates an image is embedded inside an <img> tag, it will fail to display anything if there is an error. The browser will show an empty image marker, usually a box containing a red cross. The best way to debug this script is to display it in the browser directly so that the error message it produces can be seen.

Make sure that any URL parameters are included, and make sure that they are the same parameters as those produced by the outer HTML page. Sometimes the error is a badly formed dynamically produced URL or parameters that have not been correctly URL Encoded.
*Tip* - When a page with an embedded script shows an empty image marker right-click on the page with the mouse and select "View Source". Find the <img> tag and copy and paste the URL of the image script into the browser, complete with any query string. This will recreate the conditions that caused the error. If the URL is created dynamically it is important to check that it is correct and viewing the source in the browser is the way to do this.

If it is necessary to monitor the values of variables, disable or remove the Response.ContentType and Response.BinaryWrite lines and add Response.Write commands to display these variables.
For debugging, IIS must be set to display detailed error messages. This is not the default, so changes will have to be made to the IIS configuration. The browser may also need to be configured to prevent "friendly" error messages from displaying.
A lot of ASP errors are caused by incorrect syntax and they are easily fixed once the error message can be seen.

