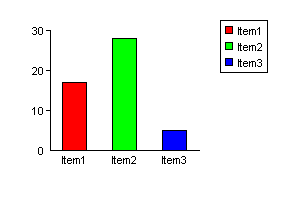
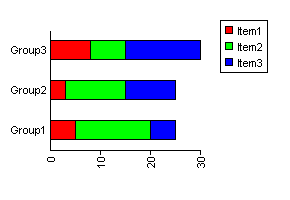
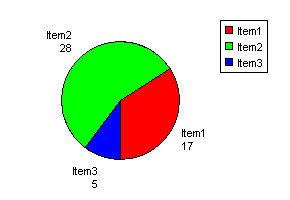
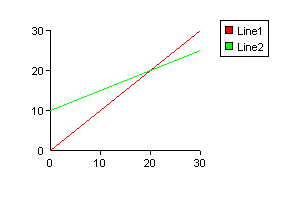
This control can be used in Windows programming environments that support ActiveX, such as Visual Basic or Delphi. It can be used to produce pie charts, line graphs or 2 different orientations of bar chart. The line graphs can display multiple lines in different colours or the points can be shown without joining them to form a scatter diagram.
There are a wide range of properties available to control the appearance, including the overall size and positioning of graph items. The text fonts, sizes and colours can all be controlled. For a full listing of properties and methods read the online manual.
As well as displaying the graph inside the control, there are functions to save the image to file or copy the image to the Windows clipboard. The image can be exported in a binary format (a variant array), which can be used to place the image into a database field or stream the image to a web browser if used in a server-side application.
There is a sample Visual Basic project included with the trial version installation. This shows how different graph are generated using some random data. Description of this example. For uninstall instructions - Click Here.
csXGraph can be used in a browser as a client side control using Javascript and we supply a signed CAB file with the full version of the control.
The component is supplied as two OCX files. One is for 32 bit systems and the other for 64 bit.
Here are some examples of graph types:


csXGraph is very similar to our popular ASP component, csDrawGraph. The main differences are over licensing details, as well as the syntax concerning fonts and colours. Both components can be used in ASP, and both components can be used in a visual environment although with csDrawGraph this is difficult because it has no visual design interface.
Full comparison between csXGraph and csDrawGraph.
csXGraph can be used with .NET and we have a downloadable example.
Existing users can upgrade to the latest version - Click for details.

