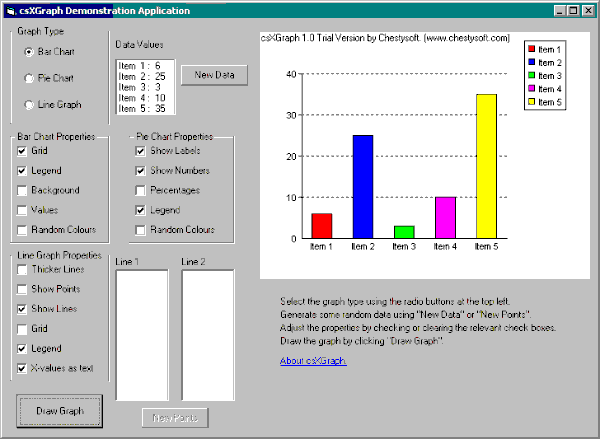
The Visual Basic Demo Application Supplied With csXGraph
A sample Visual Basic project is provided with the trial version of csXGraph. It shows how to plot a bar chart, a pie chart and a line graph and how to set some of the relevant properties. A description of how it works is provided here. You will need to have Visual Basic version 5 or 6 installed to be able to use it.

The graph type is selected using the radio buttons in the top left corner. Random data is generated by clicking "New Data" for bar and pie charts or "New Points" for line graphs. Once some data is available the "Draw Graph" button is enabled and this will display the graph.
Each graph type has some properties that can be modified by checking or clearing the appropriate check boxes. The graph will be drawn using the data shown in the relevant list box(es). To change the data click "New Data" or "New Points" again.
- For a description of the code there is a page for each graph type:
- Bar Charts.
- Pie Charts.
- Line Graphs.

