Showing Bar Charts in the Visual Basic Demo
A sample Visual Basic project is provided with the trial version of the csXGraph ActiveX control. It shows how to plot a bar chart, a pie chart and a line graph and how to set some of the relevant properties. A description of how it works is provided here. You will need to have Visual Basic version 5 or 6 installed to be able to use it.
The data displayed in a bar chart is defined in the AddData method. This takes 3 parameters, a string which is the label displayed under the bar and in the legend, a number which is the data itself, and a colour which is used to draw the bar. AddData is called once for each data item in the chart. In this example there are 5 data items and they are random integers between 0 and 99.
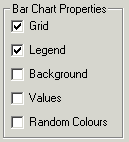
There are 5 properties that can be changed in the demo. The grid lines and the legend can either be displayed or not. The background of the graph area can be set to a different colour. The data values can be shown above the bars, and the colours can be either picked at random or specified in the code.


Here is the code for the DrawBarChart subroutine:
Private Sub DrawBarChart()
Dim I As Long
With Draw1
'Restore some default properties that might have been changed
.YGrad = 0
.YTop = 0
.OriginY = 250
.YAxisNegative = 0
'Graph is a vertical bar chart
.GraphType = dgtVBar
'Set some properties based on the check boxes
.ShowGrid = Check1.Value
.ShowLegend = Check2.Value
If Check3.Value Then
.PlotAreaColor = &HEEEEEE
Else
.PlotAreaColor = vbWhite
End If
.ShowBarTotal = Check4.Value
.UseRNDColor = Check5.Value
'Add the data values
For I = 1 To 5
.AddData "Item" + Str(I), DataValues(I), Colours(I - 1)
Next I
'Draw the graph
.DrawGraph
End With
End Sub
The ClearData method of csXGraph is called when the "Draw Graph" button is clicked. This clears existing data values but it does not restore default properties. YGrad and YTop are both set to zero so that the y-axis is autocalibrated. OriginY and YAxisNegative are restored to their default values as they will have been changed if a line graph has been plotted earlier.
The check boxes are read to set the appropriate properties. The grid is drawn using the default colour and line type. This is a black dotted line. The grid lines can be solid or dashed if the GridStyle property is changed, and the property GridColor allows them to be given an independent colour.
- For a description of the code there is a page for each graph type:
- Introduction.
- Pie Charts.
- Line Graphs.

