Showing Line Graphs in the Visual Basic Demo
The points displayed in a line graph are defined by the AddPoint method. This takes 4 parameters. There are 2 numeric values for the X and Y coordinates, a colour used to draw the line, and a label that is used in the legend box. Points that are the same colour are joined together so multiple lines can be displayed if different colours are specified in AddPoint commands. AddPoint is called once for each point on the graph. In this example there are 12 points equaly spaced along the x-axis. The y values are random and between -50 and 49.
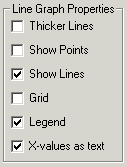
There are 6 properties that can be changed in the demo. The line thickness can be 1 or 2 pixels. The points can either be shown or hidden. The lines can be shown or hidden. A scatter diagram can be created by showing the points but not the lines. It is possible to show a graph with neither lines nor points but it is not very helpful. The grid lines and the legend can be displayed or hidden.
The final property allows the x values displayed along the axis to be replaced by text. In this example the months of the year are used.


Here is the code for the DrawLineGraph subroutine:
Private Sub DrawLineGraph()
Dim I As Long
With Draw1
'Graph is a line graph
.GraphType = dgtLine
'Set the origin and axes
.OriginY = 150
.YAxisNegative = 100
.YTop = 50
.YGrad = 10
.XTop = 11
.XGrad = 1
'Set some properties based on the check boxes
If Check11 Then
.LineWidth = 2
Else
.LineWidth = 1
End If
If Check12 Then
.PointSize = 4
.PointStyle = dgpsDot
Else
.PointSize = 0
End If
.ShowLine = Check13.Value
.ShowGrid = Check14.Value
.ShowLegend = Check15.Value
'This option replaces the x-axis values with the values
'of the Months array
If Check16 Then
.UseXAxisLabels = True
For I = 0 To 11
.AddXValue I, Months(I)
Next I
Else
.UseXAxisLabels = False
End If
'Add the data points
For I = 0 To 11
.AddPoint I, Line1Values(I), vbRed, "Line 1"
.AddPoint I, Line2Values(I), vbBlue, "Line 2"
Next I
'Draw the graph
.DrawGraph
End With
End Sub
The ClearData method of csXGraph is called when the "Draw Graph" button is clicked. This clears existing data values and is important when more than one graph can be generated by an application.
Some properties need to be set to position and divide up the axes. When negative values are plotted YAxisNegative specifies the length of the negative part of the y-axis in pixels. The total length of the y-axis is given by MaxY which defaults to 200. Setting YAxisNegative to 100 puts the origin in the middle. The y-coordinate of the origin must be moved to position the axes centrally. YTop, YGrad, XTop and XGrad specify the top points on each axis and the space between the marks.
The check boxes are read to set the appropriate properties. The first 5 properties are fairly simple. If the grid is displayed it takes the default colour and style which is a black dotted line. It could be made solid or dashed or given an independent colour if the properties GridStyle or GridColor had been used.
The last check box allows the numeric values on the x-axis to be replaced with strings. In this example the strings used are stored in an array called Months. The AddXValue method is used to replace each value on the axis with a month name. When this technique is used it is important to specify the spacing on the axis by setting XTop and XGrad. The first value is not displayed because the negative y-axis gets in the way.
- For a description of the code there is a page for each graph type:
- Introduction.
- Bar Charts.
- Pie Charts.

