Showing Pie Charts in the Visual Basic Demo
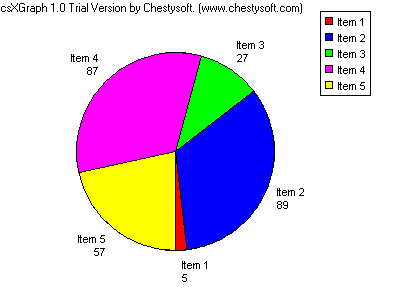
The data displayed in a pie chart is defined in the AddData method. This takes 3 parameters, a string which is the label displayed next to the pie and in the legend, a number which is the data itself, and a colour which is used to fill the pie segment. AddData is called once for each data item in the chart. In this example there are 5 data items and they are random integers between 0 and 99.
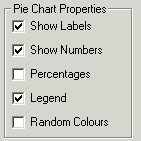
There are 5 properties that can be changed in the demo. The labels and numbers next to the pie can either be displayed or not. The numbers can be displayed as the actual values entered or as percentages of the total. The legend can be shown or not, and the colours can be either picked at random or specified in the code.


Here is the code for the DrawPieChart subroutine:
Private Sub DrawPieChart()
Dim I As Long
With Draw1
'Graph is a pie chart
.GraphType = dgtPie
'Set some properties based on the check boxes
.ShowLabel = Check6.Value
.ShowNumbers = Check7.Value
.ShowPercent = Check8.Value
.ShowLegend = Check9.Value
.UseRNDColor = Check10.Value
'Add the data values
For I = 1 To 5
.AddData "Item" + Str(I), DataValues(I), Colours(I - 1)
Next I
'Draw the graph
.DrawGraph
End With
End Sub
The ClearData method of csXGraph is called when the "Draw Graph" button is clicked. This clears existing data values and it is important if you generate the graph after clicking a button.
The check boxes are read to set the appropriate properties. All 5 properties are either true or false so the values can be taken directly from the check box.
- For a description of the code there is a page for each graph type:
- Introduction.
- Bar Charts.
- Line Graphs.

